
Safety Stock Explained: How to Set It Correctly for Your Amazon FBA Business
You've done everything right. Your supplier shipped on time, your freight forwarder hit the delivery window, and Amazon checked in your inventory without delays. Then out of nowhere, demand on your best-selling ASIN doubles for two weeks. Maybe a competitor went out of stock. Maybe an influencer mentioned your product. Doesn't matter. You're out of stock for 11 days. Your organic ranking tanks and it takes three weeks to claw back to where you were.
That's a safety stock problem. And most Amazon sellers either carry too much of it (tying up cash they can't afford to sit on) or too little of it (and eat the stockout consequences). Let's fix that.
Jump to the section you need:
What Safety Stock Actually Is (and Isn't)
Safety stock is the extra inventory you keep on hand beyond what you expect to sell during your lead time. Think of it as a buffer against the stuff you can't predict. Your customers might buy more than you expected. Your supplier might ship late. Freight might get held up at port. Safety stock is what keeps you in stock when things don't go according to plan.
Here's what safety stock is not: it's not your entire inventory. It's not a substitute for accurate forecasting. And it's definitely not a number you eyeball once and forget about.
I think of safety stock as the cost of staying in the game. You're paying for it in the form of carrying costs. Warehouse fees, tied-up capital, and Amazon's storage charges. But the alternative (a stockout) is almost always more expensive.
Here's the thing most sellers don't want to hear: stockouts will happen. If you never have a stockout, you're probably carrying way too much inventory, which means you have extra cash tied up that could be funding your next product launch, your ad spend, or just sitting in your bank account earning interest. The goal isn't zero stockouts. It's minimizing them to a level you can live with financially.
The Formula You Should Actually Use
There are a dozen safety stock formulas out there. Some are oversimplified (the "50% of lead time demand" rule of thumb). Others require a statistics PhD. Here's the one I recommend for most Amazon sellers. It accounts for both demand variability and lead time variability, and you can build it in a spreadsheet:
Let me break that down:
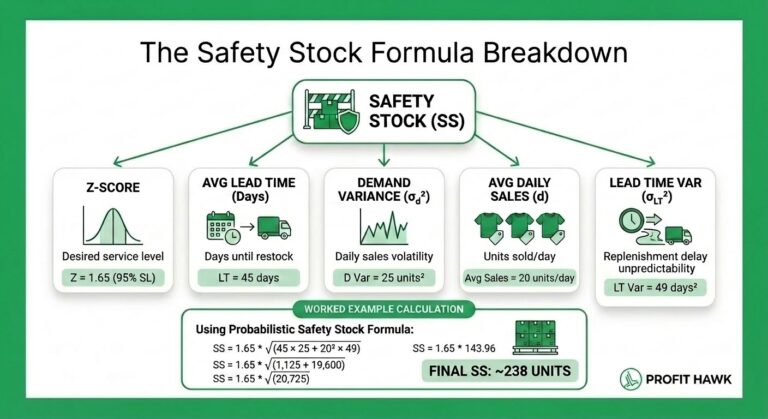
Z is your Z-score, which maps to your desired service level (more on that in a second). A 95% service level uses Z = 1.65. A 99% service level uses Z = 2.33.
Avg Lead Time is your average lead time in days. From the moment you place a PO to the moment that inventory is sellable on Amazon. This includes manufacturing, shipping, customs, last-mile to the FC, and Amazon's check-in time. That last part is critical. In 2026, FBA receiving can add 7-21 days depending on the season and fulfillment center congestion. Bake that in.
Demand Variance is the variance (standard deviation squared) of your daily demand. Pull your Amazon-only sales data for the relevant period and calculate the standard deviation. Don't blend in other channels. Your FBA safety stock should be based on FBA demand patterns only.
Avg Daily Sales is your average daily unit sales over the same period.
Lead Time Variance is the variance of your lead time. If you've placed 10 POs over the past year, track how many days each one took from order to sellable. The standard deviation of those lead times goes here.
A worked example: Let's say you sell 20 units/day on average (standard deviation = 5 units), your average lead time is 45 days (standard deviation = 7 days), and you want a 95% service level (Z = 1.65).
Safety Stock = 1.65 x sqrt(45 x 25 + 400 x 49)
Safety Stock = 1.65 x sqrt(1,125 + 19,600)
Safety Stock = 1.65 x sqrt(20,725)
Safety Stock = 1.65 x 143.96
Safety Stock = approximately 238 units
That's about 12 days of extra coverage on top of your regular pipeline inventory. For a product selling 20 units a day with meaningful lead time variability, that feels right. This safety stock figure is one of the three inputs in your reorder point formula -- it's the buffer that sits on top of your lead time demand to protect against the unexpected.
How to Pick Your Service Level Using ABC Analysis
Not every SKU in your catalog deserves the same safety stock treatment. This is where ABC analysis comes in, and I typically recommend classifying your products based on revenue or profit contribution. Not just sales volume.
A items (top 15-20% of SKUs, ~80% of revenue): These are your cash cows. A stockout on an A item is a five-alarm fire. Set your service level at 97-99% (Z = 1.96 to 2.33). Yes, you'll carry more safety stock, but the cost of a stockout (lost Buy Box, tanked ranking, 2-4 weeks of recovery) far outweighs the carrying cost.
B items (next 30% of SKUs, ~15% of revenue): Important but not critical. A 93-95% service level (Z = 1.48 to 1.65) gives you solid protection without over-investing in buffer inventory.
C items (remaining 50% of SKUs, ~5% of revenue): These are your long-tail products. A 85-90% service level (Z = 1.04 to 1.28) is usually sufficient. If a C item stocks out for a week, it's annoying, not catastrophic. Put that cash toward protecting your A items instead.
The beauty of this approach is it forces you to make conscious trade-offs. You only have so much capital and so much storage capacity, especially with Amazon tightening storage limits and hitting you with aged inventory surcharges after 181 days. ABC classification helps you allocate your safety stock budget where it actually matters.
Adjusting Safety Stock for Seasonality
This is where a lot of sellers get burned. If you calculate safety stock using the most recent 90 days of sales data and those 90 days were January through March (historically your slowest period), your safety stock number will be way too low when Q4 demand ramps up.
Use year-over-year data for the equivalent period. If you're calculating safety stock for October, pull your demand data from October of last year, not from July of this year. The seasonal index matters.
Here's a practical approach:
Calculate a seasonal index for each month or quarter: divide the average demand for that period by the overall average demand across the full year. If your October demand is typically 1.6x your annual average, your seasonal index for October is 1.6.
Then multiply your base safety stock by the seasonal index for the upcoming period. If your base safety stock is 238 units and your October seasonal index is 1.6, your October safety stock should be closer to 381 units.
For Amazon FBA specifically, also account for the lead time expansion during peak season. Shipping times from Asia have been trending longer and FBA check-in slows significantly during Q4. Your lead time variability almost certainly increases from October through January. Factor that into the formula, don't just adjust for demand.
One more thing: if you're launching a new product, you won't have historical demand data. In that case, start with a higher service level (95-97%) and more conservative safety stock for the first 3-6 months until you have enough data to calculate meaningful standard deviations. It's better to carry a bit extra early on than to stock out while you're trying to build ranking momentum.
Common Mistakes Sellers Make with Safety Stock
Mistake 1: Ignoring FBA check-in time in lead time calculations. Your lead time isn't "done" when your shipment arrives at the fulfillment center. It's done when those units are sellable. I've seen check-in delays of 3+ weeks during peak season. If you're not including that, your safety stock is effectively lower than you think.
Mistake 2: Using a single safety stock number year-round. Demand changes. Lead times change. Your safety stock should change with them. Recalculate monthly at minimum, weekly during peak season.
Mistake 3: Blending multi-channel demand data. If you sell on Amazon, Shopify, and Walmart, your FBA safety stock should be based on Amazon demand only. Each channel has its own demand pattern and its own supply chain lead time.
Mistake 4: Setting the same service level for all SKUs. A 99% service level for your entire catalog is a great way to tie up capital you don't need to. Use ABC analysis to differentiate. Your C items don't need the same protection as your A items.
Mistake 5: Forgetting about Amazon's storage penalties. In 2026, aged inventory surcharges kick in at 181 days, and the Low Inventory Level fee penalizes you if you drop below 28 days of supply. You're managing a narrow band. Too much inventory costs you in storage fees, too little costs you in stockout penalties and lost sales. Safety stock helps you stay in the sweet spot, but only if you're calculating it thoughtfully. Your inventory turnover ratio tells you whether you're actually hitting that sweet spot or drifting toward one extreme.
Quick Checklist: Setting Your Safety Stock Right
Do these now:
- Pull your last 12 months of Amazon-only daily sales data for each SKU
- Calculate the standard deviation of daily demand
- Track your last 5-10 POs and calculate average lead time and its standard deviation. Include FBA check-in time.
- Classify your catalog using ABC analysis (by revenue or profit)
- Assign service levels: A items = 97-99%, B items = 93-95%, C items = 85-90%
- Plug into the formula: Z x sqrt(Avg LT x Demand Variance + Avg Sales squared x LT Variance)
- Adjust for seasonality using year-over-year seasonal index
- Set a calendar reminder to recalculate monthly (weekly during Q4)
Watch out for:
- Amazon's 181-day aged inventory surcharge threshold
- Low Inventory Level fees below 28 days of supply
- FBA check-in delays expanding your effective lead time
- New products without enough historical data for reliable calculations
Safety stock isn't a set-it-and-forget-it number. It's a living calculation that should evolve with your business, your data, and the Amazon landscape. Get it right, and you protect your ranking, your Buy Box, and your cash flow. Get it wrong in either direction and you're leaving money on the table.
If you're managing this manually in spreadsheets today, you already know how painful it is to update across dozens or hundreds of SKUs. That's exactly the kind of problem we built Profit Hawk to solve. Automated replenishment calculations that factor in your real lead times, demand patterns, and service level targets. But whether you use a tool or a spreadsheet, the principles above will get you pointed in the right direction.
15+ years in the Amazon selling world, helping hundreds of brands figure out inventory without losing their minds. I built Forecastly, which became the go-to tool for Amazon inventory forecasting before Jungle Scout acquired it. After leading Product and Design at Jungle Scout for several years, I missed being close to the real problems sellers face. In 2025, I kept hearing the same thing: inventory tools were too complex, too expensive, or just didn't fit. So I built Profit Hawk.

[…] Safety stock is your buffer against two types of uncertainty: demand spikes and supply delays. In other words, it protects you when sales come in higher than expected or inventory arrives later than planned. […]
[…] going out of stock crushes momentum and takes weeks to rebuild. If you haven't dialed in your safety stock formula, that's the place to […]
[…] customs gets backed up or your factory hits a snag) your whole timeline extends, pushing your safety stock requirements higher. Now let’s talk about why this matters so […]
[…] directories, the edge comes from operational complexity. Knowing exactly when to reorder, how much safety stock to carry by SKU, how your inventory distribution affects your ranking, what your true landed cost is after all the […]
[…] this formula to calculate your safety stock for each […]
[…] EOQ finds the sweet spot between these two forces. For FBA sellers specifically, this matters more than it does for most businesses because Amazon charges you directly for storage, and those charges escalate aggressively the longer your inventory sits. […]